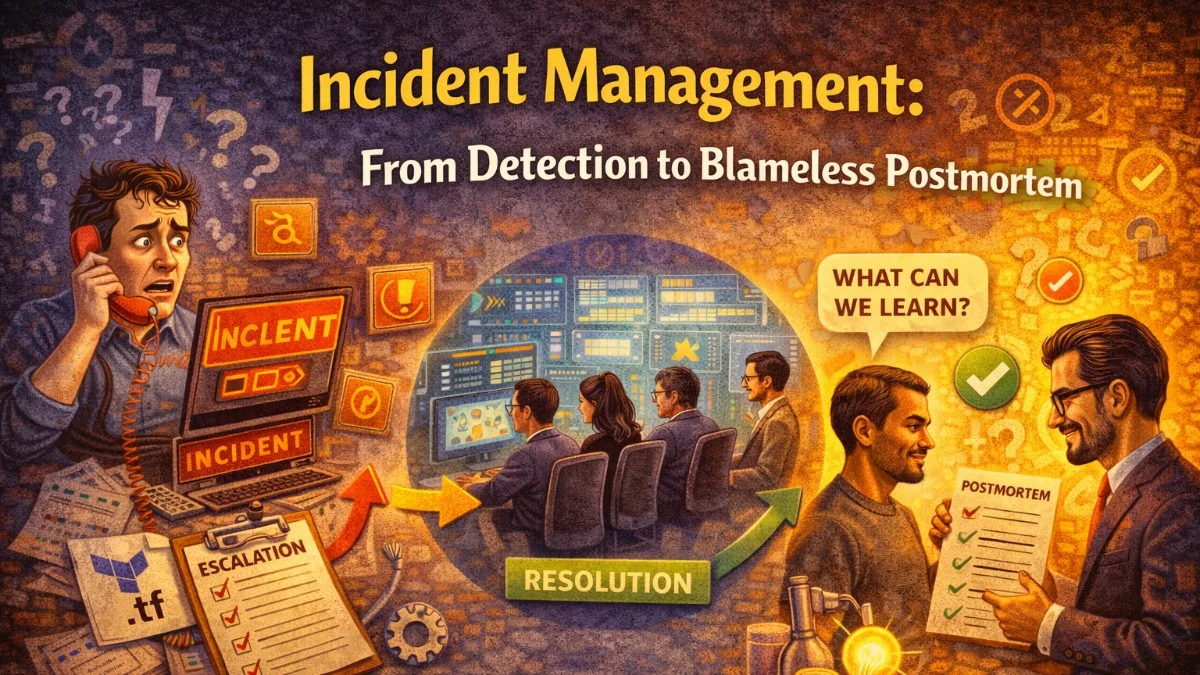
Every team that runs software in production will have incidents. The question is not whether they happen but how you handle them when they do. A well-run incident process minimizes time to recovery, maintains clear communication under pressure, and converts painful experiences into lasting improvements.
This is not a theoretical framework. These are the concrete practices that mature engineering teams use.
Detection: The Faster the Better
Mean time to detection (MTTD) is as important as mean time to recovery (MTTR). An incident you know about in 30 seconds is recoverable; one you discover after 30 minutes of customer impact is a crisis.
Alert on symptoms, not just causes:
# Prometheus alert rules — alert on what users experience
groups:
  - name: user-experience
    rules:
      - alert: HighErrorRate
        expr: |
          sum(rate(http_requests_total{status=~"5.."}[5m]))
          /
          sum(rate(http_requests_total[5m]))
          > 0.05
        for: 2m
        labels:
          severity: critical
        annotations:
          summary: "Error rate {{ $value | humanizePercentage }} exceeds 5%"
          runbook: "https://runbooks.internal/high-error-rate"

      - alert: SlowResponseTime
        expr: histogram_quantile(0.95, rate(http_request_duration_seconds_bucket[5m])) > 2.0
        for: 5m
        labels:
          severity: warning
        annotations:
          summary: "P95 latency is {{ $value }}s (threshold: 2s)"

      - alert: ServiceDown
        expr: up{job="myapp"} == 0
        for: 1m
        labels:
          severity: critical
        annotations:
          summary: "{{ $labels.instance }} is down"
Alerts should go to the right place immediately:
# Alertmanager routing — critical alerts go to PagerDuty
route:
  receiver: slack-default
  group_wait: 30s
  group_interval: 5m
  repeat_interval: 4h
  routes:
    - match:
        severity: critical
      receiver: pagerduty-critical
      continue: true
    - match:
        severity: critical
      receiver: slack-critical

receivers:
  - name: pagerduty-critical
    pagerduty_configs:
      - routing_key: $PAGERDUTY_INTEGRATION_KEY
        severity: critical

  - name: slack-critical
    slack_configs:
      - api_url: $SLACK_WEBHOOK_URL
        channel: '#incidents'
        title: 'CRITICAL: {{ .CommonAnnotations.summary }}'
        text: 'Runbook: {{ .CommonAnnotations.runbook }}'
Declaring and Structuring Incidents
The moment you suspect a significant problem, declare an incident. Declaring early is not crying wolf — it is engaging the response process before things get worse. You can always stand down if the investigation shows it is minor.
Design a Slack bot or simple command to create an incident channel:
# Simple incident bot using Slack API
import slack_sdk
import datetime

def declare_incident(severity: str, title: str, declared_by: str):
    client = slack_sdk.WebClient(token=SLACK_BOT_TOKEN)

    timestamp = datetime.datetime.utcnow().strftime('%Y%m%d-%H%M')
    channel_name = f"incident-{timestamp}-{severity.lower()}"

    # Create the incident channel
    channel = client.conversations_create(name=channel_name, is_private=False)
    channel_id = channel['channel']['id']

    # Pin the incident context
    context_message = client.chat_postMessage(
        channel=channel_id,
        text=f"*Incident Declared*\n"
             f"*Severity:* {severity}\n"
             f"*Title:* {title}\n"
             f"*Declared by:* {declared_by}\n"
             f"*Declared at:* {datetime.datetime.utcnow().isoformat()}Z\n\n"
             f"*Incident Commander:* Unassigned — first person to join, claim IC role\n"
             f"*Communication Lead:* Unassigned\n\n"
             f"Runbooks: https://runbooks.internal"
    )
    client.pins_add(channel=channel_id, timestamp=context_message['ts'])

    # Announce in #incidents
    client.chat_postMessage(
        channel='incidents',
        text=f":rotating_light: *{severity} Incident Declared*: {title}\nJoin: <#{channel_id}>"
    )

    return channel_id
Roles in an Incident
Clear role assignment eliminates confusion about who is doing what:
Incident Commander (IC): Coordinates the response. Ensures tasks are assigned. Calls out when the team needs to change direction. Does not do deep investigation — stays at the coordination level.
Lead Investigator: The person most familiar with the affected system. Digs into the root cause.
Communication Lead: Drafts and sends status page updates and customer communications. Keeps stakeholders informed so the IC is not interrupted.
Scribe: Takes timestamped notes in the incident channel. Critical for the postmortem.
Small teams may combine roles, but the IC should not also be the lead investigator — you cannot coordinate effectively while deep in a debugging session.
The Incident Timeline: Your Most Important Artifact
During the incident, the scribe (or whoever is available) adds timestamped entries to the incident channel:
14:32 UTC - High error rate alert fired (PagerDuty)
14:33 UTC - @alice declared incident, joined channel
14:35 UTC - @bob joined as Incident Commander
14:35 UTC - @carol joined as Lead Investigator
14:37 UTC - Error rate at 45%, P99 latency at 8 seconds
14:38 UTC - Posted status page update: "Investigating elevated error rates"
14:40 UTC - @carol: Errors are all 500s from /api/orders endpoint
14:42 UTC - @carol: Database connection pool exhausted — seeing "too many connections" errors
14:44 UTC - @bob: Deployed 20 minutes ago — checking deployment
14:46 UTC - @carol: Connection leak in new order service code — confirmed
14:47 UTC - @bob: Decision: rolling back deployment
14:48 UTC - Rollback started
14:51 UTC - Error rate returning to normal (< 1%)
14:53 UTC - Incident resolved. All metrics nominal.
14:54 UTC - Posted status page update: "Resolved. Root cause: connection leak in deployment, rolled back."
This timeline is the raw material for your postmortem.
Status Page Communication
Customers deserve timely, honest updates. Aim to post an initial update within 10 minutes of declaring an incident, even if you know nothing yet:
Update 1 (10 min): We are investigating elevated error rates affecting the API.
Some requests may be failing. Our team is actively working on this.

Update 2 (25 min): We have identified the issue as a database connection
problem introduced in today's deployment. We are rolling back.

Update 3 (resolved): This issue has been resolved. The root cause was a
connection leak in a code change deployed at 14:12 UTC. Service was
affected from 14:28 to 14:53 UTC. We will publish a full postmortem.
Avoid: vague language like "we are working on improving stability". Be specific: what is affected, what you know, what you are doing.
The Blameless Postmortem
A postmortem's goal is learning, not accountability. The blameless framing is not just being nice — it is epistemically correct. Human error is always the proximate cause of something; the interesting question is what system conditions made that human error possible and likely.
"Alice deployed bad code" is useless. "Our review process did not catch this class of bug, and our deployment pipeline did not have a health check that would have auto-rolled-back before significant impact" is actionable.
Conduct the postmortem within 5 business days while the incident is fresh:
Postmortem structure:
# Postmortem: API Outage — 2026-04-15

**Duration:** 14:28–14:53 UTC (25 minutes)
**Severity:** SEV-2
**Impact:** 45% of API requests failed. Estimated 1,200 users affected.
**Authors:** @alice, @bob, @carol
**Review date:** 2026-04-17

## Summary
A connection pool leak introduced in the 14:12 deployment caused database
connections to exhaust within 15 minutes, resulting in 500 errors across
all API endpoints. The deployment was rolled back and service restored at 14:53.

## Timeline
| Time (UTC) | Event |
|------------|-------|
| 14:12 | Deployment of order-service v2.4.1 |
| 14:28 | Alert: error rate > 5% |
| 14:33 | Incident declared |
| 14:40 | Root cause identified: connection pool exhausted |
| 14:47 | Decision to roll back |
| 14:53 | Service restored |

## Root Cause
A refactored database query in the order creation flow created a new PDO
connection per request instead of reusing the connection pool. Under normal
load this worked; under the traffic spike following a marketing email, the
pool exhausted.

## What Went Well
- Alert fired within 3 minutes of initial impact
- Root cause identified in 12 minutes
- Rollback completed in 4 minutes
- Status page updated within 6 minutes of incident declaration

## What Could Be Improved
- Code review did not catch the connection handling change
- No automated test for connection pool behavior under load
- Deployment health check window (2 minutes) was too short to catch this
  — issue manifested after ~15 minutes of traffic

## Action Items
| Action | Owner | Due | Priority |
|--------|-------|-----|----------|
| Add connection pool exhaustion alert | @devops | 2026-04-22 | P1 |
| Extend deployment health check window to 20 minutes | @devops | 2026-04-22 | P1 |
| Add PR checklist item for database connection handling | @alice | 2026-04-25 | P2 |
| Add load test covering connection pool behavior | @carol | 2026-05-01 | P2 |
Tracking Action Items to Completion
Postmortems that generate action items nobody follows up on destroy trust in the process. Track items explicitly:
// Link postmortem action items to your task tracker
class PostmortemAction extends Model
{
    protected $fillable = [
        'postmortem_id',
        'description',
        'owner_id',
        'due_date',
        'priority',
        'ticket_url',
        'completed_at',
    ];

    public function scopeOverdue($query)
    {
        return $query->whereNull('completed_at')
            ->where('due_date', '<', now());
    }
}
Review open postmortem action items in your weekly engineering meeting. If an action item is blocking, say so — prioritization is a choice.
The best incident management is a flywheel: each incident, handled well, leaves the system more reliable than before it happened.
Building secure, reliable systems? We help teams deliver software they can trust. scopeforged.com