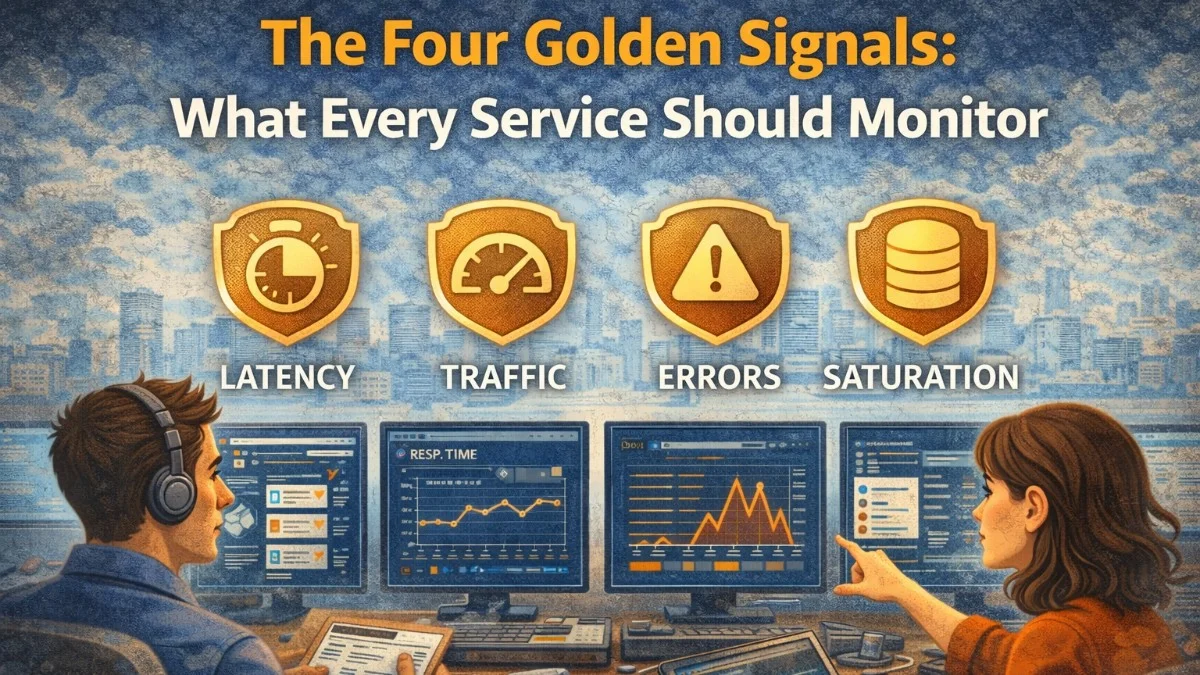
Where the Four Golden Signals Come From
In 2016, Google published the Site Reliability Engineering book—effectively their internal playbook for operating services at scale. One of its most cited concepts is the Four Golden Signals: the four metrics that, if you had to pick just four, give you the most complete picture of how a service is behaving.
The signals are:
- Latency: How long does it take to service a request?
- Traffic: How much demand is being placed on the system?
- Errors: What is the rate of failing requests?
- Saturation: How full is the service? How close to capacity?
Every service should measure all four. No single signal is sufficient on its own.
Signal 1: Latency
Latency measures how long requests take. But the average is almost always the wrong metric. Averages hide the experience of your slowest users.
Consider: 99 requests complete in 10ms and 1 request takes 10 seconds. The average is ~110ms, which sounds fine. But 1% of your users are waiting 10 seconds. That 1% is your most vocal customer, your largest account, the user who sends the screenshot to Twitter.
Measure percentiles, not averages:
- P50 (median): Half of requests are faster than this
- P95: 95% of requests are faster than this
- P99: 99% of requests are faster than this
- P999: 99.9% of requests are faster than this
In Prometheus, use histograms to calculate percentiles:
// Instrument your application
class LatencyMiddleware
{
    public function handle(Request $request, Closure $next): Response
    {
        $start = microtime(true);
        $response = $next($request);
        $duration = microtime(true) - $start;

        app(MetricsClient::class)->histogram(
            'http_request_duration_seconds',
            $duration,
            [
                'method'   => $request->method(),
                'endpoint' => Route::currentRouteName() ?? 'unknown',
                'status'   => (string) $response->status(),
            ],
            // Histogram buckets in seconds
            [0.005, 0.01, 0.025, 0.05, 0.1, 0.25, 0.5, 1, 2.5, 5, 10]
        );

        return $response;
    }
}
Query percentiles in Prometheus:
# P99 latency for all endpoints
histogram_quantile(0.99,
  sum by (le, endpoint) (
    rate(http_request_duration_seconds_bucket[5m])
  )
)

# P50 latency per endpoint
histogram_quantile(0.50,
  sum by (le, endpoint) (
    rate(http_request_duration_seconds_bucket[5m])
  )
)
Critical distinction: Measure success latency and failure latency separately. If requests fail fast (returning a 500 in 1ms), they'll make your latency look great even though users are getting errors. Track latency for 2xx responses and 5xx responses independently.
# P99 latency for successful requests only
histogram_quantile(0.99,
  sum by (le) (
    rate(http_request_duration_seconds_bucket{status=~"2.."}[5m])
  )
)
Signal 2: Traffic
Traffic measures demand on your system. It answers: how busy is this service right now, and how does that compare to normal?
For web services, traffic is usually measured in requests per second (RPS). For message queues, it's messages per second. For databases, it's queries per second.
# Requests per second, by endpoint
sum by (endpoint) (
  rate(http_requests_total[1m])
)

# Compare current traffic to same time last week
rate(http_requests_total[5m])
/
rate(http_requests_total[5m] offset 1w)
Traffic is valuable as context for other signals. An error spike during a traffic spike is a different problem than an error spike during normal traffic. High latency during a 10x traffic surge is expected; high latency during normal traffic is a bug.
Track traffic by user tier or feature flag to understand which types of requests are driving load:
app(MetricsClient::class)->increment('http_requests_total', [
    'endpoint'      => Route::currentRouteName() ?? 'unknown',
    'client_tier'   => $request->user()?->plan ?? 'unauthenticated',
    'is_api_client' => $request->expectsJson() ? 'true' : 'false',
]);
Signal 3: Errors
Errors measure the rate of failing requests. This is the most directly actionable signal: when your error rate is elevated, something is actively broken.
Measure error rate as a percentage, not an absolute count:
# Error rate as a percentage
sum(rate(http_requests_total{status=~"5.."}[5m]))
/
sum(rate(http_requests_total[5m]))
* 100
Don't confuse 4xx with 5xx. 4xx errors (client errors: bad requests, not found, unauthorized) are usually the client's fault. High 4xx rates might indicate API misuse or a broken client integration, but they're not necessarily your service failing. 5xx errors (server errors) are your fault and warrant immediate attention.
Track explicit errors, not just HTTP status codes. Some failures return HTTP 200 with an error payload. Track application-level error events:
public function generateInvoice(Invoice $invoice): InvoiceResult
{
    try {
        $result = $this->doGenerate($invoice);

        app(MetricsClient::class)->increment('invoice_operations_total', [
            'operation' => 'generate',
            'status'    => 'success',
        ]);

        return $result;

    } catch (\Exception $e) {
        app(MetricsClient::class)->increment('invoice_operations_total', [
            'operation'  => 'generate',
            'status'     => 'error',
            'error_type' => (new \ReflectionClass($e))->getShortName(),
        ]);

        throw $e;
    }
}
Error budget tracking: Use your error rate to calculate how quickly you're consuming your SLO error budget:
# Percentage of error budget consumed in rolling 30 days
(
  sum(rate(http_requests_total{status=~"5.."}[30d]))
  /
  sum(rate(http_requests_total[30d]))
) / (1 - 0.999)  # assumes 99.9% SLO
* 100
Signal 4: Saturation
Saturation measures how "full" your service is. It's the hardest signal to measure well because "full" means different things for different resources.
Key saturation metrics for a typical web application:
CPU saturation:
# CPU usage across all instances
100 - (avg by (instance) (rate(node_cpu_seconds_total{mode="idle"}[5m])) * 100)
Memory saturation:
# Memory usage percentage
(
  node_memory_MemTotal_bytes - node_memory_MemAvailable_bytes
) / node_memory_MemTotal_bytes * 100
Database connection pool saturation:
// Track connection pool usage
app(MetricsClient::class)->gauge(
    'db_connection_pool_usage',
    DB::connection()->getDoctrineConnection()->getWrappedConnection()->getActiveConnections(),
    ['connection' => 'mysql']
);
Queue depth (saturation of your processing capacity):
// In a scheduled command or via queue metrics
app(MetricsClient::class)->gauge(
    'queue_depth',
    Queue::size('default'),
    ['queue' => 'default']
);

app(MetricsClient::class)->gauge(
    'queue_oldest_job_age_seconds',
    $this->getOldestJobAge('default'),
    ['queue' => 'default']
);
Queue depth alone isn't always meaningful—a depth of 1000 with 50 fast workers might be fine, while a depth of 100 with 1 slow worker means jobs are backing up. Track queue depth and oldest job age together.
Building the Golden Signals Dashboard
Your primary service dashboard should show all four signals on a single screen. The layout:
Top row (current health):
- Error rate % (large number, red if above threshold)
- P99 latency (large number, red if above SLO)
- Traffic (RPS, compared to last week)
- Active alerts
Second row (time series):
- Error rate over last 24h
- Latency percentiles (P50, P95, P99) over last 24h
- Traffic over last 24h
- Saturation metrics over last 24h
Third row (breakdown):
- Error rate by endpoint
- Latency by endpoint
- Traffic by client tier
- Queue depth trend
This layout answers "is anything wrong?" in seconds and "where is the problem?" in minutes.
Alerting on the Four Signals
Alert thresholds for each signal:
# Error rate
- alert: ErrorRateHigh
  expr: sum(rate(http_requests_total{status=~"5.."}[5m])) / sum(rate(http_requests_total[5m])) > 0.01
  for: 3m

# Latency
- alert: P99LatencyHigh
  expr: |
    histogram_quantile(0.99, sum by (le)(rate(http_request_duration_seconds_bucket[5m]))) > 2
  for: 5m

# Traffic anomaly (drop in traffic can indicate a problem)
- alert: TrafficDropped
  expr: |
    rate(http_requests_total[10m]) < (rate(http_requests_total[10m] offset 1w) * 0.5)
  for: 5m

# Saturation
- alert: QueueDepthHigh
  expr: queue_depth{queue="default"} > 5000
  for: 5m

- alert: MemorySaturationHigh
  expr: |
    (node_memory_MemTotal_bytes - node_memory_MemAvailable_bytes)
    / node_memory_MemTotal_bytes > 0.90
  for: 10m
Beyond the Four Signals
The four golden signals are a starting point, not a ceiling. Once you have them, extend monitoring to cover:
- Business metrics: Invoice generation rate, payment success rate, user signup rate
- Dependency health: Third-party API success rates and latency
- Correctness: Are the results right, not just present? (A calculation returning results is not the same as returning correct results)
But start with the four signals. Many teams over-instrument secondary metrics while leaving the fundamentals unmeasured. Error rate, latency, traffic, and saturation tell you whether your service is healthy. Everything else is detail.
Practical Takeaways
- Latency: measure percentiles (P50, P95, P99), not averages; track success and failure latency separately
- Traffic: use traffic as context for other signals; compare to historical baselines
- Errors: track 5xx separately from 4xx; instrument application-level errors that don't produce 5xx status codes
- Saturation: track the resources that constrain your specific service (CPU, memory, DB connections, queue depth)
- Build a single dashboard that shows all four signals; you should be able to determine service health in under 30 seconds
- Alert on all four signals with appropriate thresholds; treat traffic drops as alerts, not just traffic spikes
Need help building reliable systems? We help teams architect software that scales. scopeforged.com