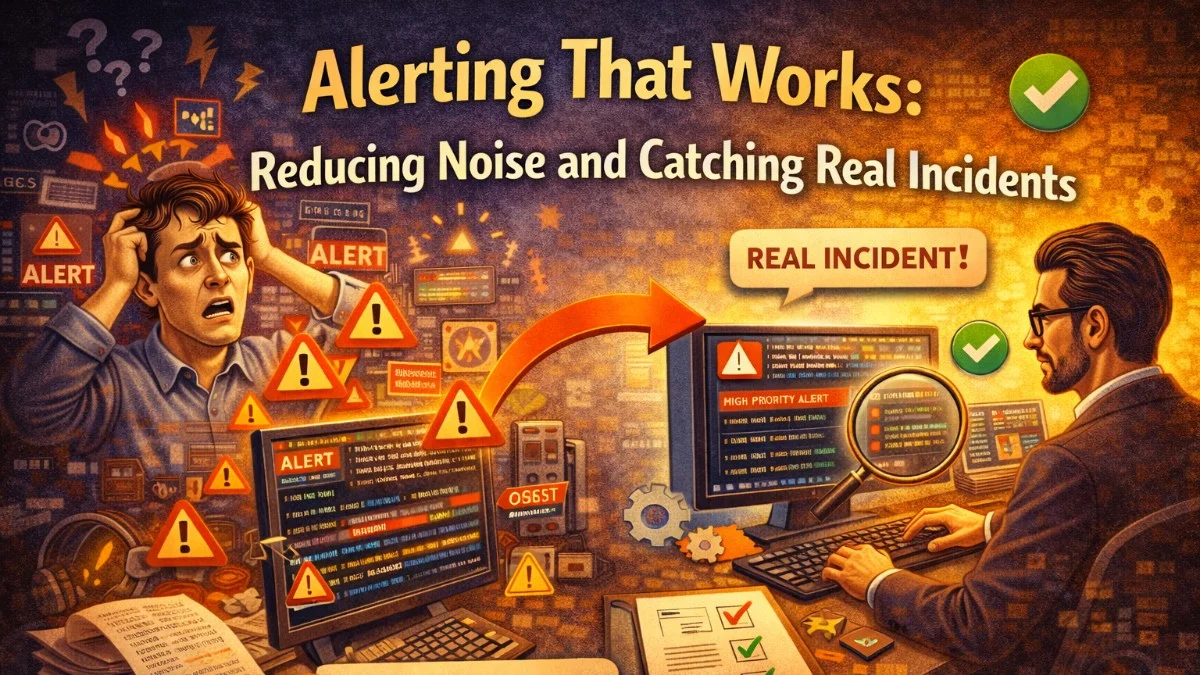
The Alerting Problem
Bad alerting is worse than no alerting. When engineers receive dozens of low-signal alerts per week, they develop alert fatigue: they start ignoring pages, delays in acknowledgment become normal, and when a real incident occurs, the alert is buried in noise.
The goal of alerting is simple: wake someone up exactly when something real is wrong, and never wake them up for anything else. Getting there requires discipline about what you alert on and how those alerts are configured.
Alert on Symptoms, Not Causes
The most important principle in alerting: alert on user-visible symptoms, not on internal system states.
Cause-based alerts (fragile, noisy):
- CPU usage above 80%
- Database connections above 90 of 100
- Queue depth above 1000 jobs
- Memory usage above 85%
Symptom-based alerts (actionable, reliable):
- Error rate above 1% for the past 5 minutes
- 99th percentile response time above 2 seconds
- Successful payment rate below 95%
- Users unable to log in
The difference: symptom-based alerts fire when users are experiencing something bad. Cause-based alerts fire when something internal looks unusual—even if users aren't affected at all. High CPU with normal response times and error rates isn't an incident; it's a capacity observation.
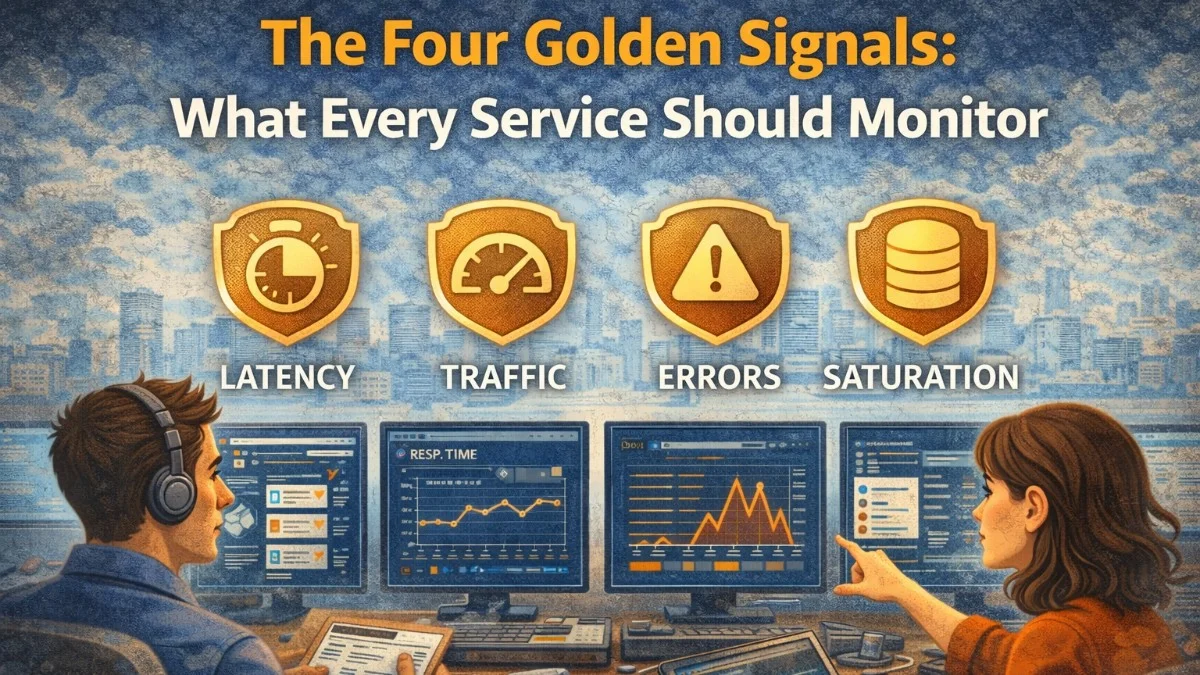
This is why the Four Golden Signals (covered in a separate article) form the foundation of good alerting: error rate, latency, traffic, and saturation are all user-observable.
The Anatomy of a Good Alert
Every alert should answer these questions before it's created:
- What is broken? Specific, not vague ("invoices are failing to generate" not "something is wrong")
- Who is affected? All users? Premium users? A specific region?
- How do I investigate? Link directly to the relevant dashboard or runbook
- What action should I take? Clear first steps for the on-call engineer
- Can this wait until morning? If yes, don't page; send a Slack message instead
Here's a well-structured alert definition in Prometheus alerting rules:
groups:
  - name: billing
    rules:
      - alert: PaymentSuccessRateLow
        expr: |
          sum(rate(payment_completed_total{status="success"}[5m]))
          /
          sum(rate(payment_completed_total[5m]))
          < 0.90
        for: 3m
        labels:
          severity: critical
          team: billing
        annotations:
          summary: "Payment success rate below 90%"
          description: |
            Payment success rate is {{ humanizePercentage $value }} over the last 5 minutes.
            This directly impacts revenue. Investigate immediately.
          runbook_url: "https://runbooks.internal/billing/payment-failures"
          dashboard_url: "https://grafana.internal/d/billing-overview"
The for: 3m is critical: the condition must persist for 3 minutes before firing. This eliminates alerts from transient spikes.
Severity Levels That Mean Something
Define severity levels that drive consistent behavior:
P1 - Critical: Service is down or severely degraded. Users cannot complete core workflows. Page immediately, regardless of time of day. Expected response: within 5 minutes.
P2 - High: Significant degradation affecting a subset of users or a non-critical workflow. Page during business hours; wake up on-call after hours only if trending toward P1. Expected response: within 30 minutes.
P3 - Medium: Degradation present but manageable. No paging; create a ticket and address during business hours. Expected response: within 24 hours.
P4 - Low: Informational. Something worth knowing about but not urgent. Slack notification or weekly review. Expected response: next sprint.
Map your alerts to these levels explicitly. An alert with no severity level defaults to P1 in most people's instinct, which is how alert fatigue starts.
Setting Thresholds Statistically
Arbitrary thresholds ("alert if error rate > 1%") lead to both false positives and false negatives. Better thresholds are based on historical baselines and statistical deviation.
Percentile-based thresholds: Instead of "alert if P99 latency > 500ms", alert when P99 latency is 3x higher than its 7-day average for the same time of day:
- alert: LatencyAnomalous
  expr: |
    (
      histogram_quantile(0.99, rate(http_request_duration_bucket[5m]))
      /
      histogram_quantile(0.99, rate(http_request_duration_bucket[5m] offset 7d))
    ) > 3
  for: 5m
This alert is resilient to normal variation between weekdays and weekends, and between peak and off-peak hours.
Burn rate alerts: Instead of point-in-time threshold alerts, burn rate alerts calculate how quickly you're consuming your error budget. A high burn rate means you're on track to exhaust your SLO before the window ends:
# Alert if error budget burn rate would exhaust it in < 1 hour
- alert: ErrorBudgetBurnRateCritical
  expr: |
    sum(rate(http_requests_total{status=~"5.."}[1h]))
    /
    sum(rate(http_requests_total[1h]))
    > (1 - 0.999) * 14.4   # 14.4 = hourly burn multiplier for 30-day SLO
Grouping and Routing
Not all alerts should go to the same place. Route alerts to the right team with the right urgency:
# Alertmanager routing configuration
route:
  receiver: default
  group_by: [alertname, cluster]
  group_wait: 30s       # Wait to collect related alerts
  group_interval: 5m    # Re-notify interval for ongoing issues
  repeat_interval: 4h   # Don't repeat resolved alerts for 4 hours

  routes:
    - matchers:
        - team = billing
        - severity = critical
      receiver: billing-pagerduty

    - matchers:
        - team = billing
        - severity = high
      receiver: billing-slack

    - matchers:
        - team = infrastructure
        - severity =~ critical|high
      receiver: infra-pagerduty

receivers:
  - name: billing-pagerduty
    pagerduty_configs:
      - routing_key: ${PAGERDUTY_BILLING_KEY}
        description: '{{ .GroupLabels.alertname }}'

  - name: billing-slack
    slack_configs:
      - channel: '#billing-alerts'
        title: '{{ .GroupLabels.alertname }}'
        text: '{{ range .Alerts }}{{ .Annotations.description }}{{ end }}'
Grouping is essential: if a deployment triggers 20 alerts simultaneously, Alertmanager should send one notification about a group of related alerts, not 20 individual pages.
Runbooks: The Most Underrated Alert Component
Every P1 and P2 alert must have a runbook linked in its annotations. A runbook answers:
- How do I verify the alert is real and not a false positive?
- What are the most common causes of this alert?
- What are the immediate mitigation steps?
- Who should I escalate to if the issue persists?
A basic runbook format:
# Payment Success Rate Low

## Alert Condition
Payment success rate below 90% for more than 3 minutes.

## Verification
1. Check the Billing Overview dashboard
2. Look at recent Stripe API error logs: `CloudWatch > /app/billing > filter ERROR`
3. Check Stripe status page: https://status.stripe.com

## Common Causes
- Stripe API outage (check status page)
- Invalid API key after rotation (check Secrets Manager)
- Webhook endpoint certificate expired
- Surge of declined cards (check fraud patterns)

## Immediate Mitigation
- If Stripe outage: enable fallback payment capture mode
- If API key issue: rotate via `./scripts/rotate-stripe-key.sh`
- If webhook issue: check certificate expiry in ACM

## Escalation
- After 15 minutes without resolution: page @billing-lead
- After 30 minutes: page @cto
Runbooks turn 2am incidents from "confused engineer fumbling in the dark" into "engineer following a clear checklist."
Measuring Alert Quality
Track these metrics to know if your alerting is improving:
- Alert-to-incident ratio: What percentage of alerts correspond to real incidents? Under 80% means too many false positives.
- Mean time to acknowledge (MTTA): Long MTTA suggests alert fatigue or unclear ownership.
- Alert volume per week: This should be trending down over time as false positives are eliminated.
- False positive rate by alert: Identify your noisiest alerts and fix or remove them.
Review these metrics in a monthly on-call retrospective.
Practical Takeaways
- Alert on user-visible symptoms (error rate, latency) not internal metrics (CPU, queue depth)
- Use
forduration in alert rules to eliminate transient spikes - Define explicit severity levels and consistent response expectations for each
- Group related alerts so one deployment doesn't generate 20 pages
- Write runbooks for every P1/P2 alert and link them in alert annotations
- Track alert quality metrics monthly and eliminate your noisiest false positives
Need help building reliable systems? We help teams architect software that scales. scopeforged.com