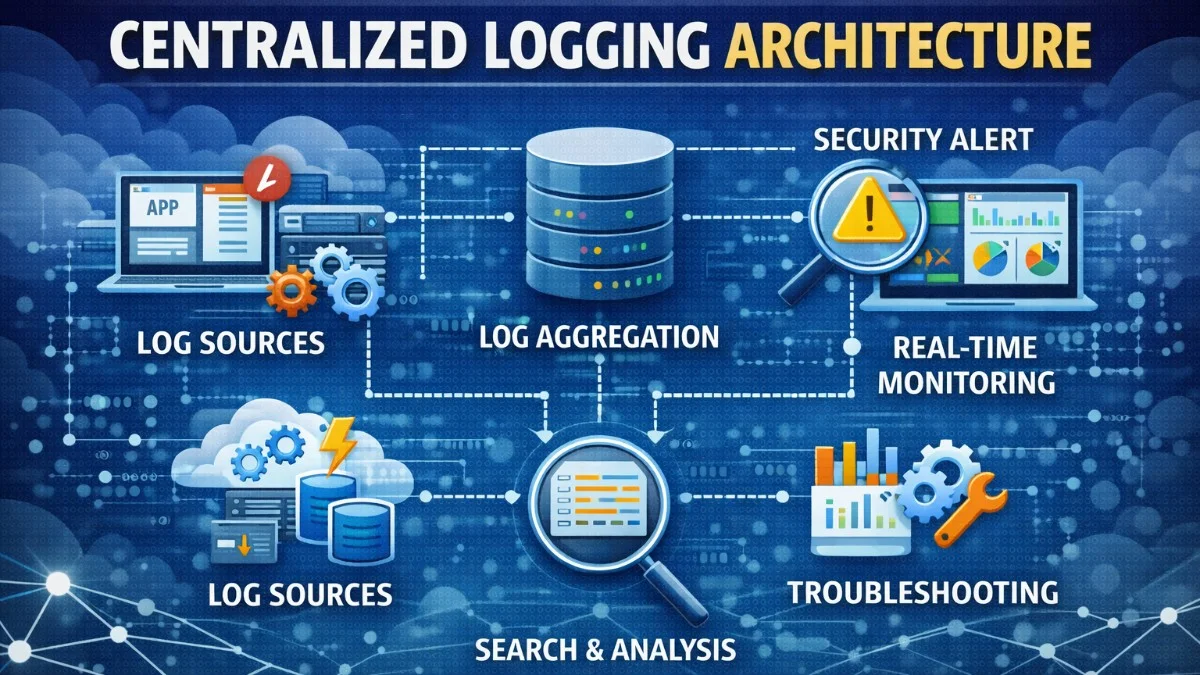
When applications grow beyond a single server, logging becomes challenging. Logs scattered across multiple servers are nearly impossible to search, correlate, or analyze. Centralized logging aggregates logs from all sources into a searchable, unified system.
Why Centralize Logs?
Distributed System Challenges
- Multiple servers: Logs spread across instances
- Containers: Ephemeral, logs disappear when container dies
- Microservices: Request spans multiple services
- Scale: Too many logs to read manually
Benefits of Centralization
- Single source of truth: All logs in one place
- Search and filter: Find specific events quickly
- Correlation: Trace requests across services
- Alerting: Automated detection of issues
- Analytics: Identify patterns and trends
The ELK Stack
Components
Elasticsearch: Search and analytics engine Logstash: Data processing pipeline Kibana: Visualization and exploration
Architecture
The data flows from your applications through various shippers into Elasticsearch, where Kibana provides the query interface. Understanding this flow helps you troubleshoot when logs are not appearing as expected.
Application -> Filebeat -> Logstash -> Elasticsearch <- Kibana
           or
Application -> Direct API -> Elasticsearch
Docker Compose Setup
You can run the entire ELK stack locally with Docker Compose for development and testing purposes. This setup mirrors production architecture without the complexity of distributed deployment.
# docker-compose.yml
version: '3.8'
services:
  elasticsearch:
    image: docker.elastic.co/elasticsearch/elasticsearch:8.12.0
    environment:
      - discovery.type=single-node
      - xpack.security.enabled=false
    ports:
      - "9200:9200"
    volumes:
      - elasticsearch-data:/usr/share/elasticsearch/data

  kibana:
    image: docker.elastic.co/kibana/kibana:8.12.0
    ports:
      - "5601:5601"
    environment:
      - ELASTICSEARCH_HOSTS=http://elasticsearch:9200

  logstash:
    image: docker.elastic.co/logstash/logstash:8.12.0
    volumes:
      - ./logstash/pipeline:/usr/share/logstash/pipeline
    ports:
      - "5044:5044"

volumes:
  elasticsearch-data:
Note that xpack.security.enabled=false is only appropriate for local development. In production, you must enable security and configure proper authentication. The volume mount ensures your data persists across container restarts.
Structured Logging
Why Structure Matters
Compare these two log entries. The first is human-readable but machine-unfriendly, making automated analysis nearly impossible.
Unstructured:
[2024-01-15 10:30:45] User john@example.com logged in from 192.168.1.1
Structured logs use JSON, making them queryable and parseable by machines while remaining readable by humans.
Structured:
{
  "timestamp": "2024-01-15T10:30:45Z",
  "level": "info",
  "event": "user.login",
  "user_email": "john@example.com",
  "ip_address": "192.168.1.1",
  "user_agent": "Mozilla/5.0..."
}
Structured logs enable:
- Precise filtering:
event:user.login AND level:error - Aggregation: Count logins per hour
- Correlation: Find all events for a user
Laravel Structured Logging
Configure Laravel to output JSON logs by setting up custom channels in your logging configuration. This enables Elasticsearch to parse your logs without additional processing.
// config/logging.php
'channels' => [
    'stack' => [
        'driver' => 'stack',
        'channels' => ['stderr', 'elasticsearch'],
    ],

    'stderr' => [
        'driver' => 'monolog',
        'handler' => StreamHandler::class,
        'formatter' => JsonFormatter::class,
        'with' => [
            'stream' => 'php://stderr',
        ],
    ],

    'elasticsearch' => [
        'driver' => 'custom',
        'via' => App\Logging\ElasticsearchLoggerFactory::class,
    ],
],
The stack driver lets you write to multiple destinations simultaneously, useful for sending logs to both stdout (for container orchestration) and Elasticsearch (for search). This redundancy ensures you have access to logs through multiple channels.
Adding Context
Context transforms generic logs into actionable data. Add application-wide context and request-specific context to every log entry.
// Add context to all logs
Log::shareContext([
    'service' => 'web-api',
    'version' => config('app.version'),
    'environment' => config('app.env'),
]);

// Request-specific context (middleware)
public function handle($request, Closure $next)
{
    $requestId = Str::uuid()->toString();

    Log::shareContext([
        'request_id' => $requestId,
        'user_id' => $request->user()?->id,
    ]);

    $response = $next($request);

    $response->headers->set('X-Request-ID', $requestId);

    return $response;
}

// Log with context
Log::info('Order created', [
    'order_id' => $order->id,
    'total' => $order->total,
    'items_count' => $order->items->count(),
]);
The X-Request-ID header helps you correlate client-side errors with server-side logs. When a user reports an issue, ask them for this ID. The service and version context helps you filter logs when debugging specific deployments.
Log Shipping
Filebeat
Lightweight shipper that reads log files and forwards them to Logstash or Elasticsearch. Filebeat is ideal when you cannot modify application code to log directly or when applications write to files.
# filebeat.yml
filebeat.inputs:
  - type: log
    enabled: true
    paths:
      - /var/log/laravel/*.log
    json.keys_under_root: true
    json.add_error_key: true

output.elasticsearch:
  hosts: ["elasticsearch:9200"]
  index: "laravel-%{+yyyy.MM.dd}"
The json.keys_under_root setting flattens JSON fields to the root level, making them easier to query in Kibana. Without this, all your fields would be nested under a json key.
Direct API Shipping
Send logs directly from application to Elasticsearch, bypassing the file system entirely. This approach has lower latency but requires handling failures gracefully in your application.
// app/Logging/ElasticsearchLoggerFactory.php
class ElasticsearchLoggerFactory
{
    public function __invoke(array $config): Logger
    {
        $handler = new ElasticsearchHandler(
            Client::create()->setHosts([config('services.elasticsearch.host')]),
            [
                'index' => 'laravel',
                'type' => '_doc',
            ],
            Logger::DEBUG
        );

        return new Logger('elasticsearch', [$handler]);
    }
}
Consider buffering logs and sending them in batches to reduce network overhead and handle temporary connectivity issues. A batch size of 100-500 messages typically works well.
Fluentd/Fluent Bit
A unified logging layer popular in Kubernetes environments. Fluent Bit is the lightweight version suitable for resource-constrained environments like containers.
# fluent-bit.conf
[INPUT]
    Name              tail
    Path              /var/log/containers/*.log
    Parser            docker
    Tag               kube.*
    Refresh_Interval  5

[OUTPUT]
    Name  es
    Match *
    Host  elasticsearch
    Port  9200
    Index laravel
    Type  _doc
In Kubernetes, you typically run Fluent Bit as a DaemonSet, with one instance per node collecting logs from all containers. This pattern scales automatically as you add nodes.
Logstash Pipelines
Basic Pipeline
Logstash transforms and enriches log data before indexing. This pipeline parses JSON logs, extracts timestamps, and adds geographic information from IP addresses.
# logstash/pipeline/laravel.conf
input {
  beats {
    port => 5044
  }
}

filter {
  # Parse JSON logs
  json {
    source => "message"
  }

  # Parse timestamp
  date {
    match => ["timestamp", "ISO8601"]
    target => "@timestamp"
  }

  # Add geo information from IP
  geoip {
    source => "ip_address"
    target => "geoip"
  }

  # Remove sensitive fields
  mutate {
    remove_field => ["password", "credit_card"]
  }
}

output {
  elasticsearch {
    hosts => ["elasticsearch:9200"]
    index => "laravel-%{+YYYY.MM.dd}"
  }
}
The geoip filter is particularly useful for security analysis, letting you visualize login attempts on a world map and detect suspicious geographic patterns. The mutate filter ensures sensitive data never reaches your log storage.
Kibana Configuration
Index Patterns
Create index pattern: laravel-*
Useful Queries
Kibana Query Language (KQL) makes searching logs intuitive. Here are queries you will use frequently when investigating issues.
# Errors in last hour
level:error AND @timestamp:[now-1h TO now]

# Specific request
request_id:"abc-123-def"

# User's activity
user_id:42 AND event:*

# Slow requests (>1s)
response_time_ms:>1000

# Failed orders
event:order.created AND status:failed
Dashboards
Build dashboards for:
- Error rates over time
- Request latency percentiles
- Top error messages
- User activity patterns
Request Tracing
Correlation IDs
Correlation IDs let you trace a single request across multiple services. Generate them at the entry point and propagate through all downstream calls.
// Generate at entry point
$correlationId = request()->header('X-Correlation-ID') ?? Str::uuid()->toString();

// Pass to downstream services
Http::withHeaders([
    'X-Correlation-ID' => $correlationId,
])->get('http://other-service/api');

// Include in all logs
Log::shareContext(['correlation_id' => $correlationId]);
When debugging a distributed issue, search for the correlation ID to see the complete request journey across all services. This single search reveals the full picture.
Distributed Tracing
For complex systems, consider OpenTelemetry. It provides more detailed timing and relationship information than correlation IDs alone, including parent-child relationships between spans.
use OpenTelemetry\API\Trace\TracerProviderInterface;

class OrderController
{
    public function __construct(
        private TracerProviderInterface $tracerProvider
    ) {}

    public function store(Request $request)
    {
        $tracer = $this->tracerProvider->getTracer('web-api');
        $span = $tracer->spanBuilder('create-order')->startSpan();

        try {
            $order = $this->orderService->create($request->validated());
            $span->setAttribute('order.id', $order->id);
            return response()->json($order);
        } finally {
            $span->end();
        }
    }
}
OpenTelemetry integrates with backends like Jaeger, Zipkin, or cloud-native solutions, providing visual trace timelines and dependency maps. The try/finally pattern ensures spans are always closed, even when exceptions occur.
Alerting
Elasticsearch Watcher
Configure automated alerts when error patterns emerge. This watcher triggers when more than 10 errors occur in a 5-minute window, notifying your team via Slack.
{
  "trigger": {
    "schedule": { "interval": "5m" }
  },
  "input": {
    "search": {
      "request": {
        "indices": ["laravel-*"],
        "body": {
          "query": {
            "bool": {
              "must": [
                { "match": { "level": "error" } },
                { "range": { "@timestamp": { "gte": "now-5m" } } }
              ]
            }
          }
        }
      }
    }
  },
  "condition": {
    "compare": { "ctx.payload.hits.total.value": { "gt": 10 } }
  },
  "actions": {
    "slack_notification": {
      "webhook": {
        "url": "https://hooks.slack.com/..."
      }
    }
  }
}
Tune your thresholds based on normal error rates. Too sensitive and you get alert fatigue; too lenient and you miss real issues. Start conservative and adjust based on experience.
Grafana Alerts
Configure alerts on log queries with notification channels.
Best Practices
Log Levels
Use log levels consistently to enable effective filtering. Inconsistent levels make it impossible to find what you need.
Log::emergency('System is unusable');
Log::alert('Action must be taken immediately');
Log::critical('Critical conditions');
Log::error('Error conditions');
Log::warning('Warning conditions');
Log::notice('Normal but significant');
Log::info('Informational messages');
Log::debug('Debug-level messages');
Guidelines:
- Error: Something failed and needs attention
- Warning: Something unexpected but handled
- Info: Business events (user login, order created)
- Debug: Technical details for troubleshooting
What to Log
Do log:
- Authentication events (login, logout, failed attempts)
- Authorization failures
- Business events (order placed, payment processed)
- Errors and exceptions
- External API calls
- Performance metrics
Don't log:
- Passwords or secrets
- Full credit card numbers
- Personal health information
- Session tokens
Retention
Configure index lifecycle management to balance storage costs with retention requirements. This policy automatically manages your indices over time.
# Elasticsearch ILM policy
{
  "policy": {
    "phases": {
      "hot": {
        "actions": {
          "rollover": {
            "max_size": "50GB",
            "max_age": "1d"
          }
        }
      },
      "warm": {
        "min_age": "7d",
        "actions": {
          "shrink": { "number_of_shards": 1 }
        }
      },
      "delete": {
        "min_age": "30d",
        "actions": { "delete": {} }
      }
    }
  }
}
This policy keeps hot data for fast queries, moves older data to warm storage after a week, and deletes data after 30 days. Adjust these timeframes based on your compliance and debugging needs. Some regulations require longer retention periods.
Conclusion
Centralized logging transforms how you operate applications at scale. Start with structured JSON logs, ship them to Elasticsearch with Filebeat or direct API calls, and build Kibana dashboards for visibility. Add correlation IDs to trace requests across services, and set up alerts for critical errors. The investment in logging infrastructure pays dividends when debugging production issues.