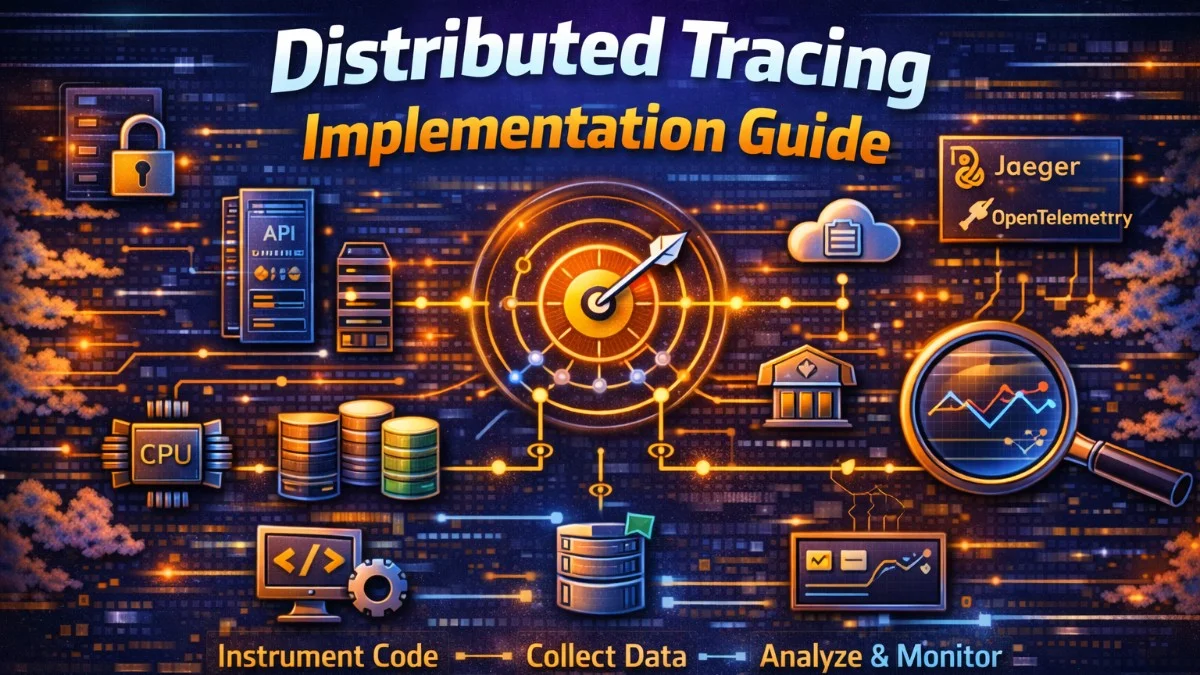
Distributed Tracing Implementation Guide
Implement distributed tracing in your services. Add instrumentation, correlate requests, and debug latency issues.
Monitoring, logging, tracing, metrics, and system observability.
Implement distributed tracing in your services. Add instrumentation, correlate requests, and debug latency issues.
Master Prometheus for application monitoring. Learn PromQL, alerting rules, and Grafana dashboard best practices.
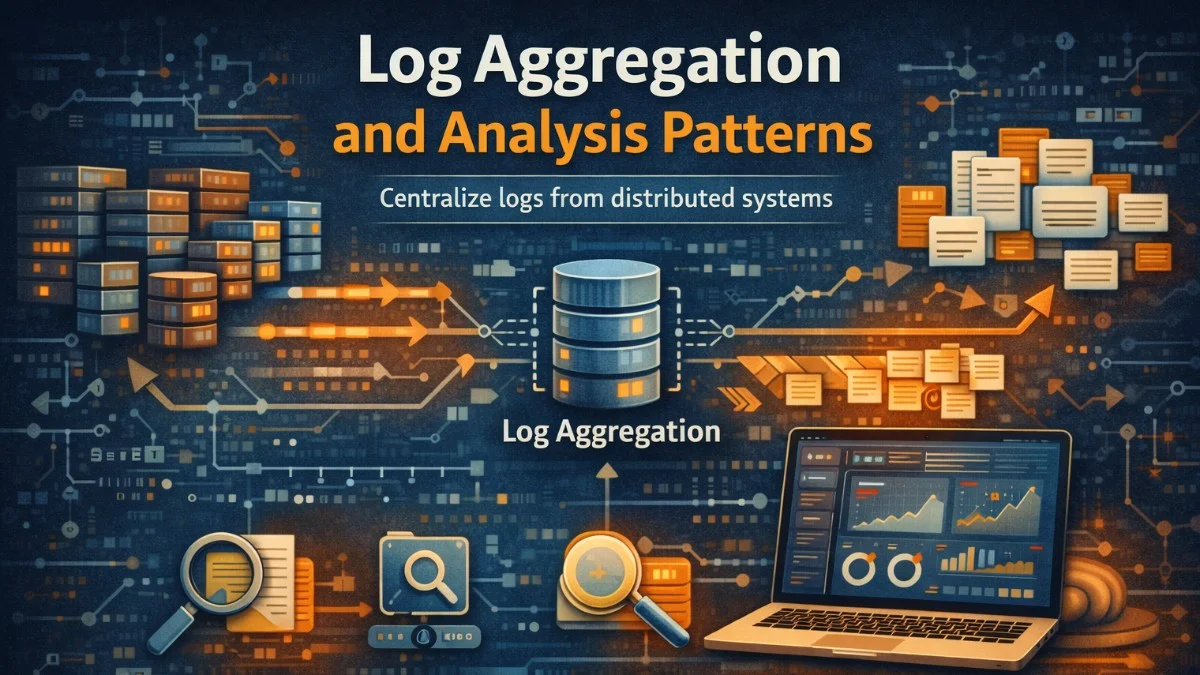
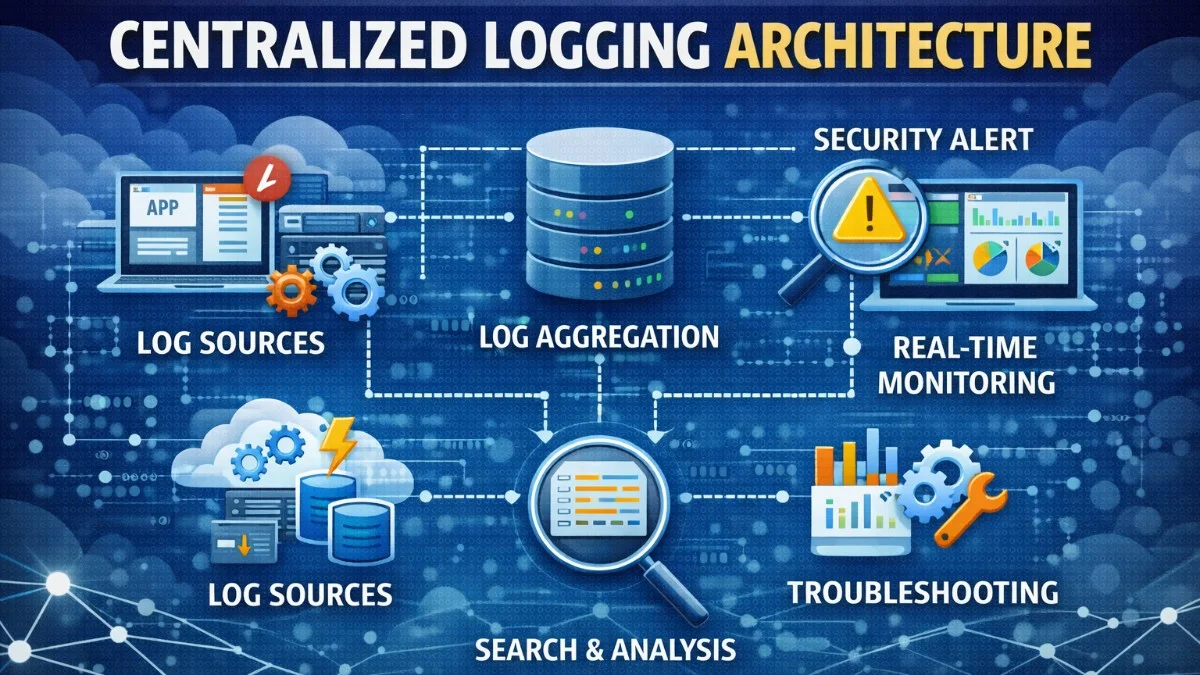
Centralize logs from distributed systems. Build searchable, structured logging with correlation and alerting.
Understand the distinction between monitoring and observability. Learn the three pillars and when to use each approach.
Trace requests across microservices with OpenTelemetry. Implement spans, context propagation, and visualization with Jaeger.
Define meaningful SLOs for your services. Learn to measure reliability, set error budgets, and make data-driven decisions.
Build a logging infrastructure that scales. Learn the ELK stack, structured logging, and log aggregation best practices.
Build observability into your applications from the start. Learn the three pillars and implement effective alerting.
Let's discuss how we can help you build reliable software.
We use cookies to analyze site usage and improve your experience. By continuing to use this site, you agree to our use of cookies. Learn more about our privacy policy