Trace Sampling: Head, Tail, and Adaptive Approaches
Sample traces without losing the ones that matter. Compares head, tail, and adaptive sampling.
Monitoring, logging, tracing, metrics, and system observability.
Sample traces without losing the ones that matter. Compares head, tail, and adaptive sampling.
Set up OTel collectors, instrumentation, and exporters as one cohesive pipeline.
Wire deployment frequency, lead time, change-fail rate, and MTTR into your existing tools — without a vendor.
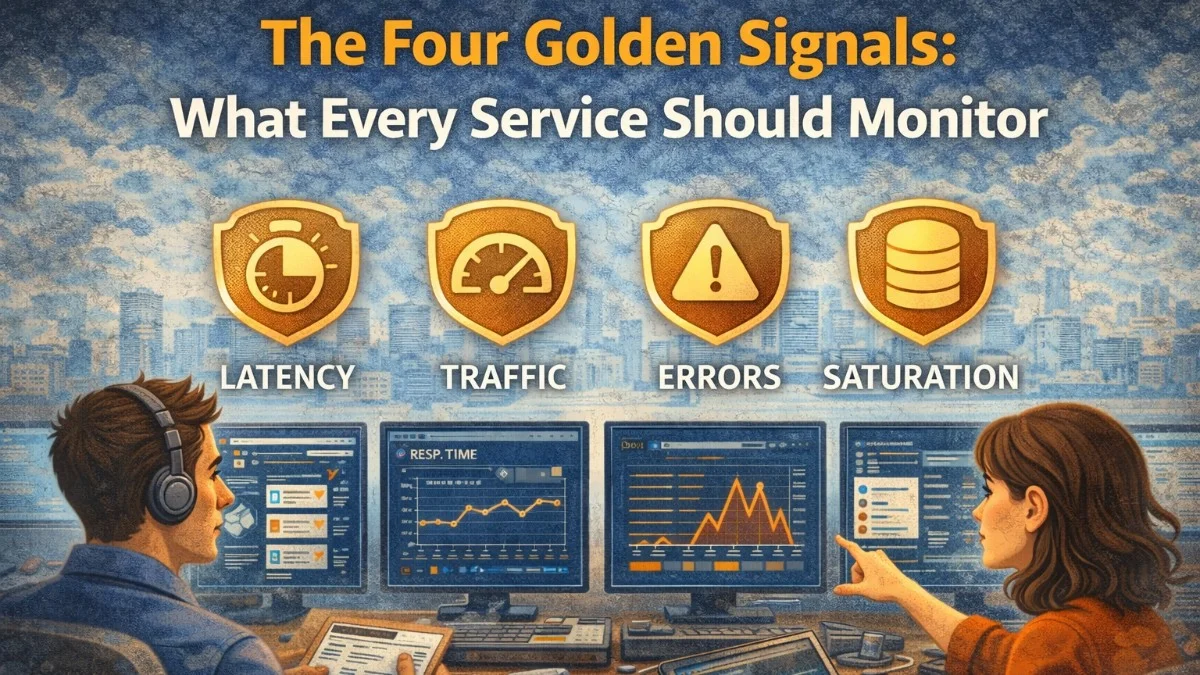
Google's Site Reliability Engineering book defines four signals that, together, give you a complete picture of service health: latency, traffic, errors, and saturation. Here's how to implement them.
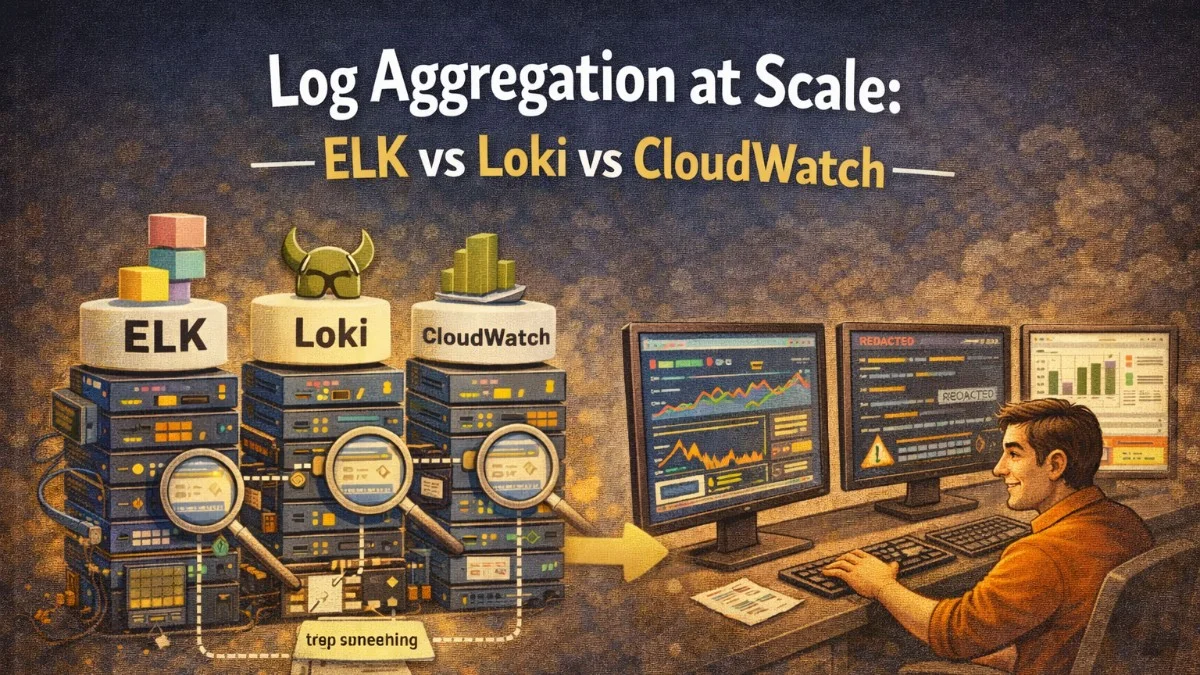
Choosing a log aggregation stack is one of the highest-leverage infrastructure decisions you'll make. ELK, Loki, and CloudWatch each have different strengths. Here's how to pick the right one.
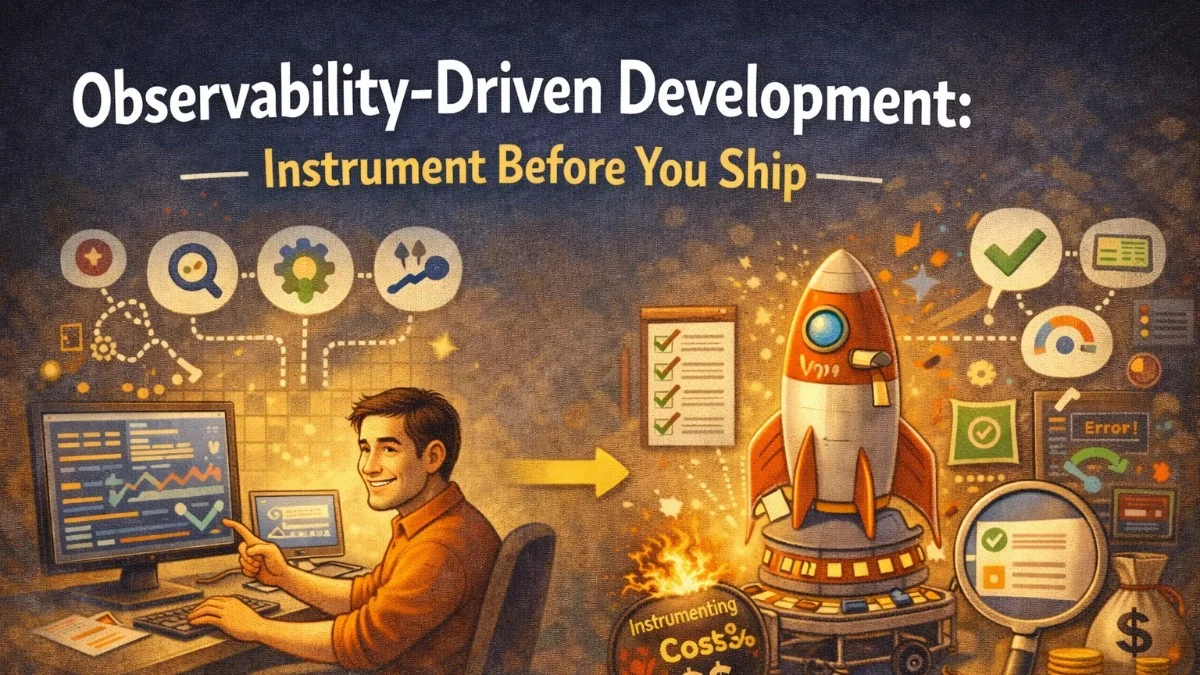
Most teams add instrumentation after something breaks in production. Observability-driven development flips this: you instrument code before it ships, so you can understand its behavior from the first deployment.
Adding a user ID label to a Prometheus metric seems harmless. With 100,000 users, it creates 100,000 unique time series. This is cardinality explosion, and it will crash your monitoring stack.
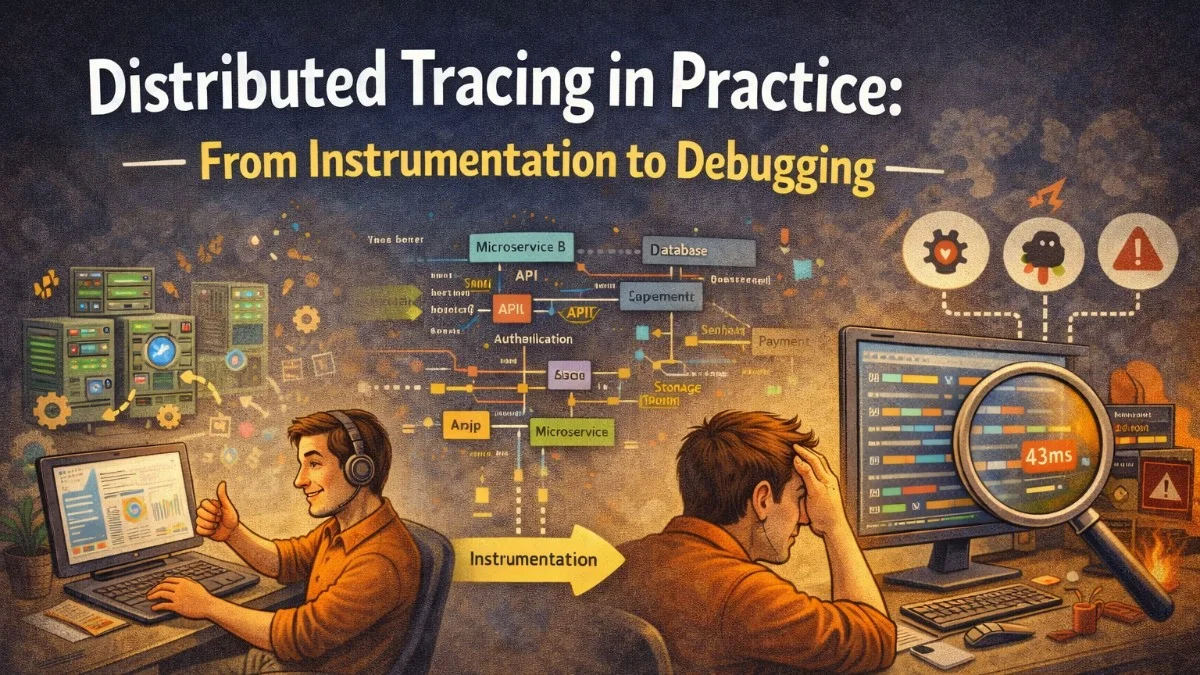
When a request spans five services and takes 3 seconds, logs alone won't tell you where the time went. Distributed tracing shows you the complete request path, timing, and failures across your entire system.
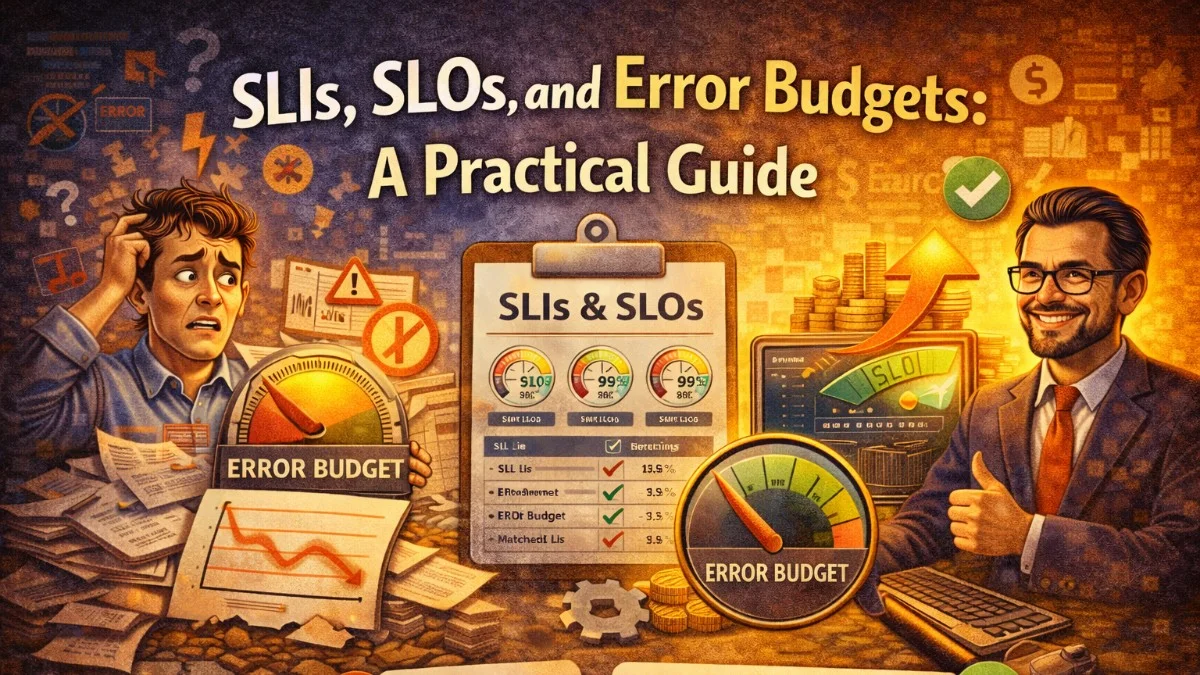
SLIs, SLOs, and error budgets give reliability a language that engineers and business stakeholders can reason about together. Here's how to implement them practically, not just theoretically.
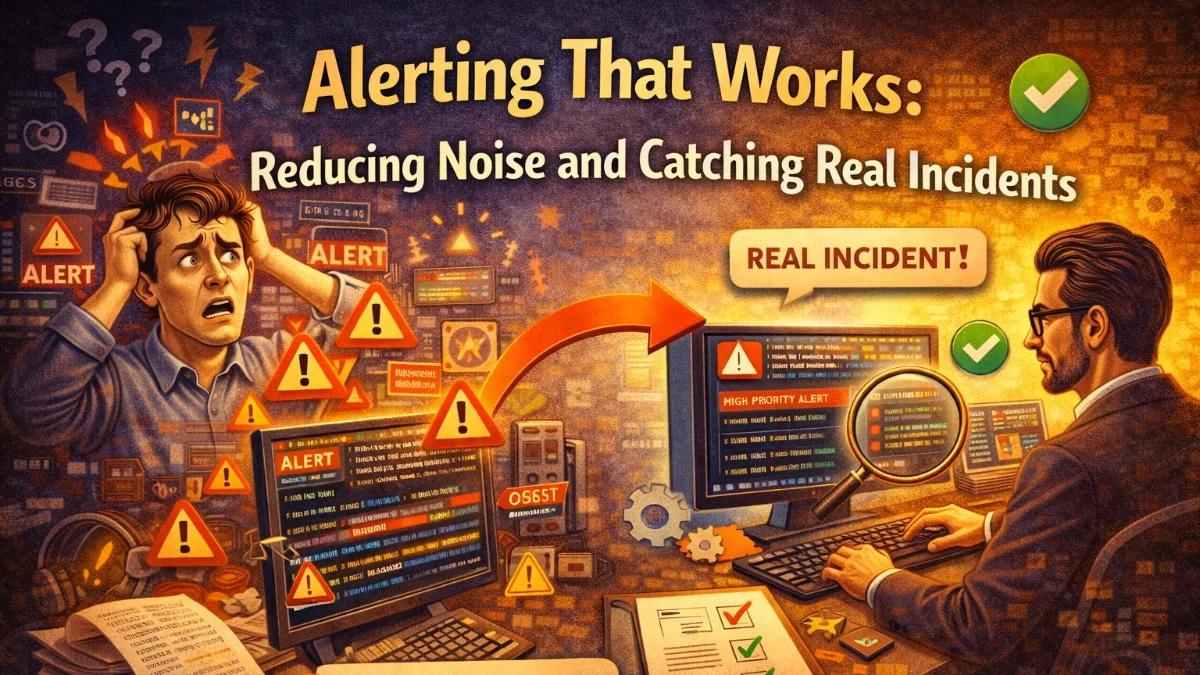
Most alert systems page engineers too often for things that don't matter, and not quickly enough for things that do. Here's how to build an alerting strategy that your on-call team will actually trust.
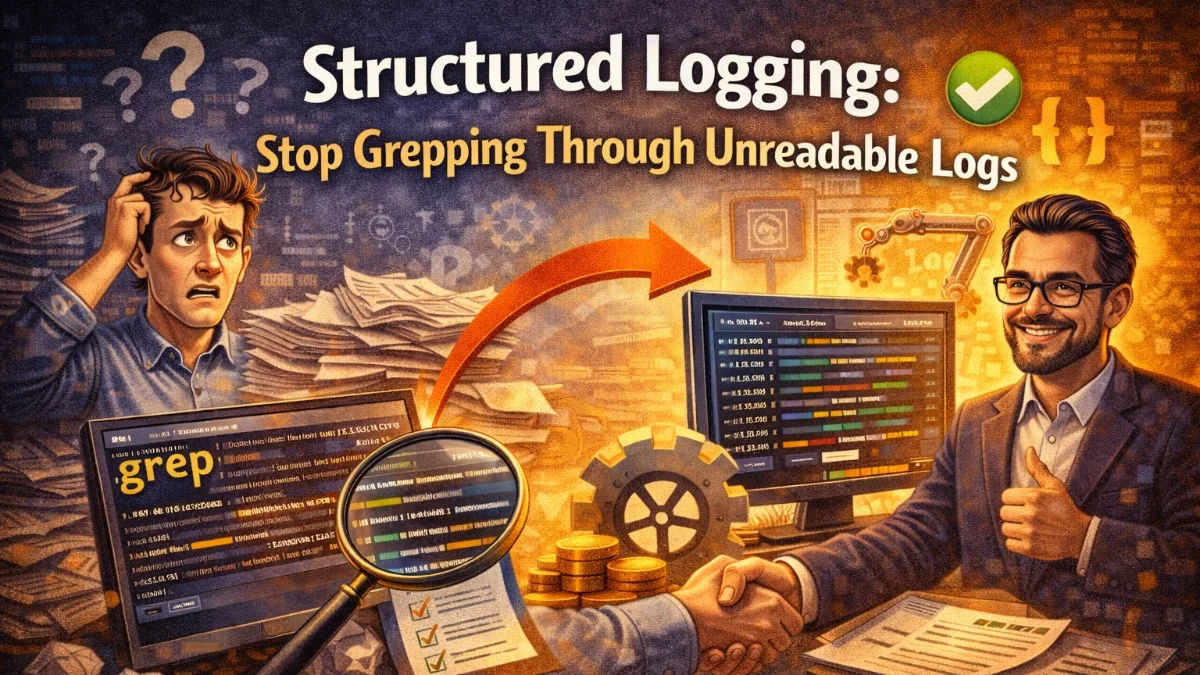
Unstructured log lines are nearly impossible to search, aggregate, or alert on at scale. Structured logging transforms your logs into queryable data that actually helps you debug production issues.
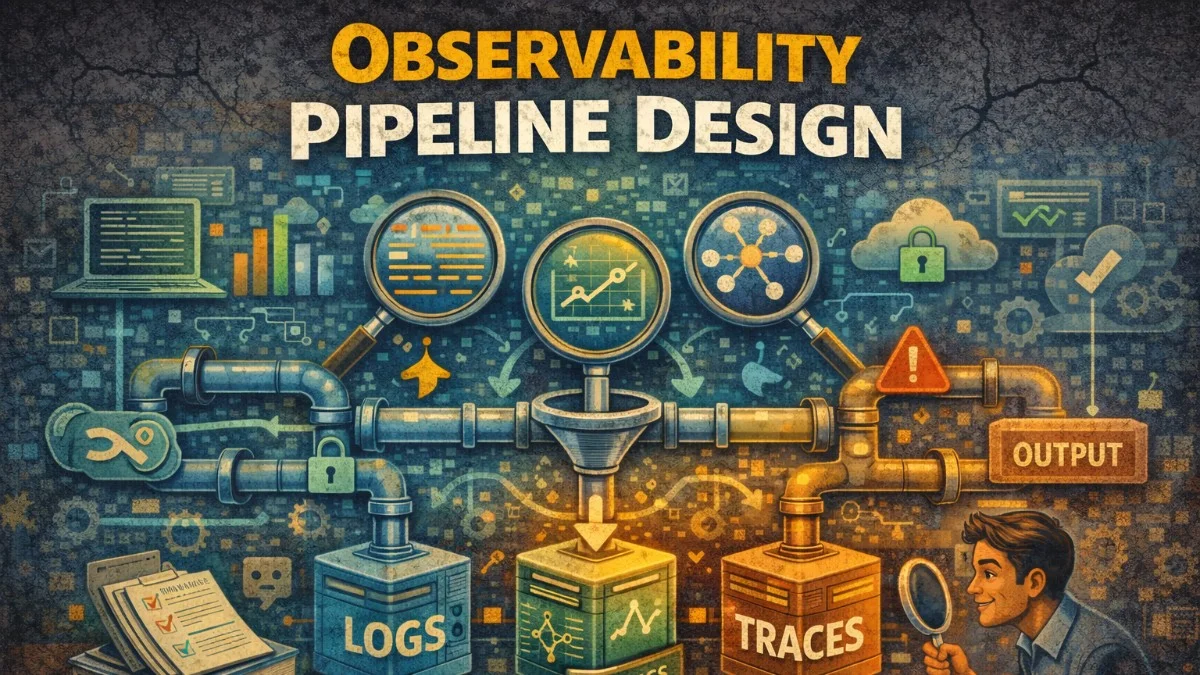
Build scalable observability infrastructure. Collect, process, and store telemetry data efficiently.
Let's discuss how we can help you build reliable software.
We use cookies to analyze site usage and improve your experience. By continuing to use this site, you agree to our use of cookies. Learn more about our privacy policy